Mesenchymal Stem Cell (MSC) Clinical Trial Data Visualization

See trends in mesenchymal stem cell research from more than 300 trials with a simple, online tool.
With hundreds of clinical trials in various stages of evaluation, MSCs are one of the most commonly used stem cells in current clinical applications. Get a bird’s-eye view of research involving MSCs with the Clinical Trial Visualization Tool, an interactive data visualization that has pulled together data from clinicaltrials.gov on over 300 trials involving MSCs.
Trials can be sorted by the following categories:
- Recruitment status
- Year
- Allogeneic versus autologous
- Funding source
The following information can be displayed for any individual trial listed:
- Trial sponsor
- Trial name
- Conditions targeted
- Interventions
- Age group
- Estimated enrollment
- Primary completion date
- NCT number
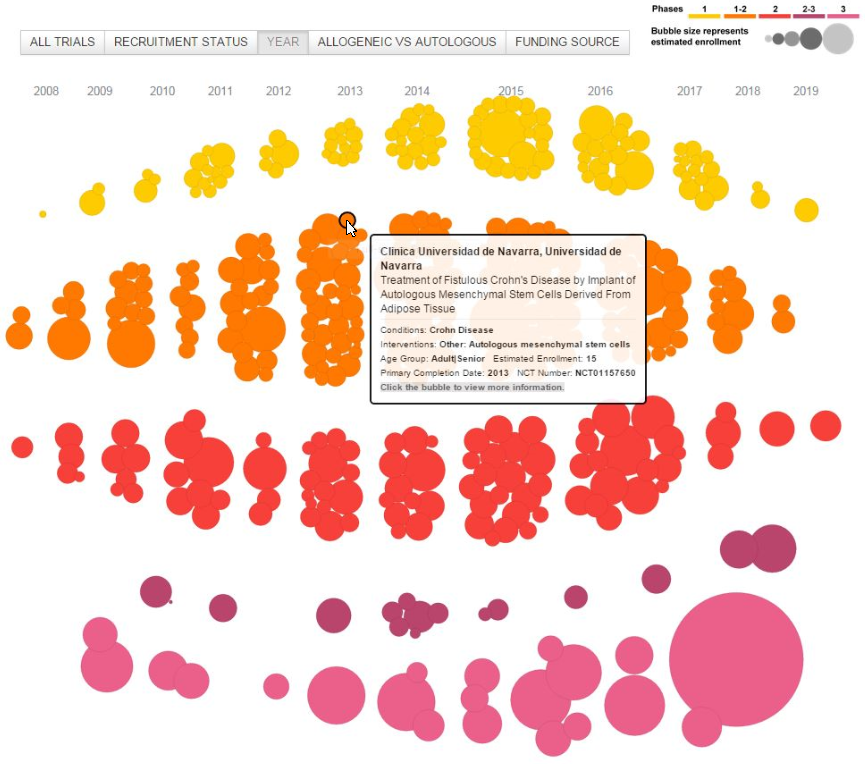
Caption: MSC clinical trials, represented by circles, are categorized by year in the Clinical Trial Visualization Tool. Circle size represents the estimated enrollment and circle color represents the phase of the correlating trial at the time the data was last pulled from clinicaltrials.gov.
The Clinical Trial Visualization Tool allows you to quickly sort hundreds of MSC clinical trials and readily view key data points of each trial.